Introduction
There’s no debate about whether investors should buy new properties or existing ones.
“It is mathematically impossible for new property to outperform old property”
It has always been an open and shut case.
In this presentation I’ll show how the historical data supports what the math predicts. And I’ll cover all those pointless arguments that pushers of “new property” like to bring up…
- Depreciation
- Stamp duty savings
- Rent
- Vacancy
- Repairs and maintenance
The reason there appears to be two sides to the argument is because on one side you have a small minority of experienced property investors putting forward logic, maths and historical evidence. While on the other side you have an enormous number of property developers and their network of partners weaving their marketing magic to earn a buck.
Depreciation
One of the biggest selling points of new properties is the “high depreciation benefits”. Stop and think about that for a second or two.
As an investor, you’re looking to buy an asset, not a liability. An asset grows in value – it APPRECIATES. A liability depreciates. So, how on earth can depreciation be considered a “benefit”.
Example
Which of the following 2 properties has a higher depreciation?
- Property A – old
- Total value: $500,000
- Land value: $300,000
- Building value: $200,000
- Total value: $500,000
- Property B – new
- Total value: $500,000
- Land value: $200,000
- Building value: $300,000
- Total value: $500,000
Both properties are the same value. But the property with the most depreciation “benefits” is property B, the new one. It has a brand-new dwelling which cost $300,000 to build. Whereas property A has an old dwelling with not nearly as much depreciation left in it.
What property developers want you to see, is this:
- Property A – old
- Total value: $500,000
- Land value: $300,000
- Building value: $200,000
- Total value: $500,000
- Property B – new
- Total value: $500,000
- Land value: $200,000
- Building value: $300,000 ➜ BIG DEPRECIATION BENEFITS!
- Total value: $500,000
As an investor, however, here’s how you should be looking at it:
- Property A – established
- Total value: $500,000
- Land value: $300,000 ➜ MORE ASSET
- Building value: $200,000 ➜ LESS LIABILITY
- Total value: $500,000
- Property B – new
- Total value: $500,000
- Land value: $200,000 ➜ LESS ASSET
- Building value: $300,000 ➜ MORE LIABILITY
- Total value: $500,000
Now tell me which is the better investment? If you buy a new property, more of your money is paying for a liability. If you buy an established or old property, more of your money is paying for an asset. You want to buy assets, not liabilities. But…
“Each rental property comes with some liability (the building) sitting on top of the asset (the land)”
For the best capital growth, you want the biggest proportion of asset and the least proportion of liability. That means buying established or old properties – not buying new properties.
Land appreciates
You’ve heard that land appreciates and buildings depreciate right? So, watch what happens to the value of properties A and B over time.
Assume 7 years have passed and the land for both properties appreciated. Assume the land appreciated at exactly the same rate for both properties. Let’s assume that sufficient time passed for the land of both properties to double in value.
- 7 years later
- Property A – established
- Land value doubled: $600,000 ➜ ASSET
- Property B – new
- Land value doubled: $400,000 ➜ ASSET
The established property’s land would now be worth $600,000. It doubled from $300,000. The new property’s land is only worth $400,000. It doubled from $200,000. Both doubled in value over the same timeframe.
Buildings depreciate
Now let’s also factor in depreciation. Let’s assume that over the same 7 years, both properties depreciated at the same rate by a total of 20%.
- 7 years later
- Property A – established
- Building value: $160,000 ➜ LIABILITY
- Property B – new
- Building value: $240,000 ➜ LIABILITY
So, the old property lost $40,000 in building depreciation but gained $300,000 in land appreciation. While the new property lost $60,000 in building depreciation but gained $200,000 in land appreciation. So, the new break-down would look like this:
- 7 years later
- Property A – established
- Total value: $760,000
- Land value: $600,000 ➜ ASSET
- Building value: $160,000 ➜ LIABILITY
- Property B – new
- Total value: $640,000
- Land value: $400,000 ➜ ASSET
- Building value: $240,000 ➜ LIABILITY
Property A, the established property, has grown to $760,000 from $500,000 – a gain of $260,000. The new property has grown by only $140,000 over the same period.
Both were the same price, had the same rate of appreciation and the same rate of depreciation over the same time frame. Yet the difference is a staggering $120,000 in just 7 years.
Capital growth
Just looking at things purely from a capital growth perspective we can see there is an alarming difference:
-
- 7 years later
- Property A – established
- Total value: $760,000 (up 52%)
- Property B – new
- Total value: $640,000 (up 28%)
Despite both appreciation and depreciation rates being identical, property A has totally beat the pants off property B simply because of a combination of higher land value and lower building value.
Despite both properties being in the same market and having the same rates of growth, one has nearly doubled the performance of the other simply because it isn’t new – sounds amazing.
But it’s actually not that extreme if we consider tax.
Tax
This is where the proponents of “new” start getting noisy saying there’s all this depreciation you can claim.
You see, the established property owner, property A, has only been able to claim at most $40,000 in depreciation – and probably less since it was an established property and has different rules about depreciation claims. Let’s assume they’re only able to claim half of the depreciation loss – $20,000
But how much you claim in depreciation isn’t money in the bank. It simply comes off your taxable income so you get taxed at a lower rate. Let’s assume a high marginal tax rate of 40% to maximise the tax saving.
- 7 years later
- Property A – established
- Building value at start: $200,000
- Building value at end: $160,000
- Claim only half = $20,000 depreciation
- 40% x $20,000 = tax saving of $8,000
- Property B – new
- Building value at start: $300,000
- Building value at end: $240,000
- Claim ALL $60,000 depreciation
- 40% x $60,000 = tax saving of $24,000
If your marginal tax rate was 40% and you claimed $20,000, you’re tax savings would total $8,000. If you claimed $60,000, you’re tax savings would be $24,000. That’s a big difference.
As far as after tax cash-flow is concerned, the new property buyer looks to be better off than the old property buyer by $16,000 ($24k – $8k). But in terms of net position, net wealth created, the overall winner is the old property buyer because of the capital growth.
Worse off, not better off
Note that purely looking at depreciation and ignoring capital growth, the new property buyer is still not better off by $16,000. They’re actually worse off even ignoring the inferior capital growth. You see depreciation isn’t a “benefit”. The tax you save merely reduces the extent of what you’ve lost.
If you claim $10,000 in depreciation and pay $4,000 less tax, you’re not better off by $4,000. You’re actually worse off by $6,000. Your property has depreciated by $10,000 and you’ve claimed that loss. After tax the loss is not as bad, but it’s still a loss. Depreciation is not something an investor wants more of. It’s something they should try to minimise.
As is so often the case in property investing, capital growth easily trumps the supposed tax “benefits” of depreciation. At this stage, the old property buyer is better off by more than $100,000 even after considering a $40,000 difference in the amount of depreciation that could be claimed.
And note that it gets worse for the new property buyer if they ever decide to sell. Every cent claimed in depreciation over the life of ownership gets taken off the cost base when you sell. That means you end up paying more capital gains tax. Most of those tax savings are clawed back by the ATO in capital gains tax.
Now, don’t get me wrong, I’m not saying you shouldn’t claim depreciation if you can. What I am saying is that you can identify better investments by how little depreciation you can claim.
“The higher the depreciation, the worse an investment it is”
Because you’re paying for more liability and less asset.
Cash-flow
Now up to here, we’ve assumed that both properties had the same income and expenses over the 7-year period. But older properties will have higher maintenance expenses than newer properties. And newer properties may have higher rental income than older properties.
- 7 years later
- Property A – established
- Higher expenses by $1,500 p.a. for 7 years = $10,500
- Property B – new
- Higher rent by $30/week for 7 years = $10,920
This has closed the gap by over $20,000, but it’s still well in favour of the old property by about $80,000.
Oh, and there’s something else I didn’t consider. Those higher maintenance costs that the older property incurs are tax deductible. So, the government will ease the burden by the percentage of your marginal tax rate.
To borrow from the marketing madness of developers, I guess we’d be intitled to call these, “high maintenance benefits”.
Renovate or rebuild
Eventually, an old property will need a thorough renovation. And it’s true, that reno will come sooner for older properties than for newer ones. But the need to renovate isn’t necessarily a bad thing. It can actually be a bonus. For example:
- Spend $50k on renovation
- $80k value increase
- $30k profit
- 60% return on investment (30 / 50 = 60%)
In annualised terms, that’s fantastic and it doesn’t even consider the improvement in rental potential. But…
“You can’t renovate new properties”
Buying new, means you miss the opportunity to make those fantastic returns. If the growth doesn’t come organically, you have no other strategy to fall back on. And as we’ve seen, capital growth doesn’t come organically to new properties as much as it does for older ones.
You can even knock the existing dwelling down and build a brand-new property if it works out to be commercially viable.
- Rebuild for $300k
- $400k value increase
- $100k profit
33% ROI (100 / 300 = 33%)
In fact, this is exactly what developers do. But if you do the rebuild, the profit goes in your pocket, not theirs.
“You’re not paying ‘cost’ when you buy new, you’re paying cost + developer profit”
The value you add by a renovation or rebuild is your profit. When you buy new, that profit goes to the developer (and their business partners).
Vacancy
Now some would argue that new properties are in higher demand by tenants and therefore suffer from lower vacancies. Others claim that because new properties are released in a large bunch, there is competition for tenants among landlords and they have higher vacancies.
There is historical data to support that vacancy rates increase with increased developer activity. But I won’t bother pushing that point since it makes very little difference to the bottom line anyway. At most it’s only going to change the gap by a few thousand dollars over several years.
Putting it all together:
- 7 years later
- Property A – established
- Total value: $760,000
- Land value: $600,000
- Building value: $160,000
- Claim $20,000 depreciation (probably more)
- 40% x $20,000 = tax saving of $8,000
- Higher expenses by $1,500 p.a. for 7 years = $10,500
- $260k cap gain + $8k depr – $10.5k extra expenses = $257.5k
- Property B – new
- Total value: $640,000
- Land value: $400,000
- Building value: $240,000
- Claim $60,000 depreciation
- 40% x $60,000 = tax saving of $24,000
- Total after tax gain = $164,000
- Higher rent by $30/week for 7 years = $10,920
- $140k cap gain + $24k depr + $11k extra rent = $175k
As you can see there’s really no contest. The older property is in a completely different league. The difference to the investor over just 7 years for this price range was well over $80,000.
And nothing like: depreciation, rent, expenses, etc. can come anywhere near the difference in capital growth.
“Capital growth trumps everything”
Also note, that these two properties could be in the same suburb. They could even be right next door to each other. New will under perform old because land appreciates and buildings depreciate. It’s straightforward and kind of obvious that…
“New properties are mathematically unable to outperform old properties – all other things being equal”
Side by side
Another way to compare new vs. old is to place two properties side by side. One is old and the other is new. Their land is identical in every way. It has the same size, frontage, orientation, slope, soil quality – everything. Both land values are identical. Let’s say they’re both valued at $300,000. This is for the land only.
Now assume on top of one block of land is an old property. And assume on top of the other block of land there is a new property. Let’s say the older dwelling has been valued at $100,000 and the new dwelling has been valued at $300,000.
The total value of both properties would therefore be:
- Old property
- Land value = $300,000
- Dwelling value = $100,000
- Total value = $400,000
- New property
- Land value = $300,000
- Dwelling value = $300,000
- Total value = $600,000
The new property is $200,000 more expensive than the old property or 50%. Let’s see how that difference changes over time.
Imagine ten years have passed and both blocks of land have doubled. In the same time the buildings have depreciated by 25%.
- Old property
- Land value = $600,000
- Dwelling value = $75,000
- Total value = $675,000
- New property
- Land value = $600,000
- Dwelling value = $225,000
- Total value = $825,000
Now the new property is only $150,000 more expensive than the old one or 22%. The gap has closed from 50% to 22%. And remember that depreciation is not a good thing. It’s something to be avoided. This comparison unfairly favours the new property because depreciation is much faster in new properties than in older ones.
Reduced stamp duty
Another big claim that property developers make about the so-called benefits of new property is the savings on stamp duty. Imagine you’re buying a house and land package. Let’s say it’s for $500,000. But the house hasn’t been built yet. You buy the land first and then contract the developer to build the house on it.
Stamp duty is paid on the transfer of ownership of the land. Since the land is only worth $200,000, you only pay a small stamp duty fee. At 4%, which is a rough guideline, it would be $8,000. Once the land is yours, you then pay the developer to build a house on it. In this example the build cost is $300,000.
- New property
- $500k H&L package
- Buy land $200k
- Stamp duty = $8k (4% x $200k)
- Build house ($300k)
Versus
- Old property
- $500k property ($200k land + $300k house)
- Stamp duty = $20k (4% x $500k)
If you bought the property with the house already built, you’d pay stamp duty on the transfer of ownership of a $500,000 property. The stamp duty would then be $20,000. That’s $12,000 more stamp duty you’re paying.
But it’s not as simple as that. Buying the land first, you will have to pay interest on a loan to buy the $200,000 parcel of land and wait for the house to be built. Over that time, you’re not getting any rent. There may be some other holding costs too like interest on progress payments to get the house built. There may be delays in the project too.
Stamp duty saving:
- $20k – $8k = $12k
- Minus $5k interest (6 months @ 5% interest on $200k)
- Interest on progress payments ~$2k
- Net saving = $5k
If you were to buy an established house, you’re only paying interest without rent for the period of time it typically takes to find a tenant, which is weeks, not months. And there’s always the possibility the property you bought already has a tenant “installed”.
In the end the stamp duty saving is not that significant. Some of you might think that several thousand dollars is indeed significant. But it’s all relative. Compared to the inferior capital growth that new properties deliver, a $5,000 stamp duty saving is trivial. Once again,
“Capital growth trumps everything”
Capital growth vs. Stamp duty
And I’ve even done some rough calculations to see how capital growth will be affected in the early years of ownership of a new property with high stamp duty savings.
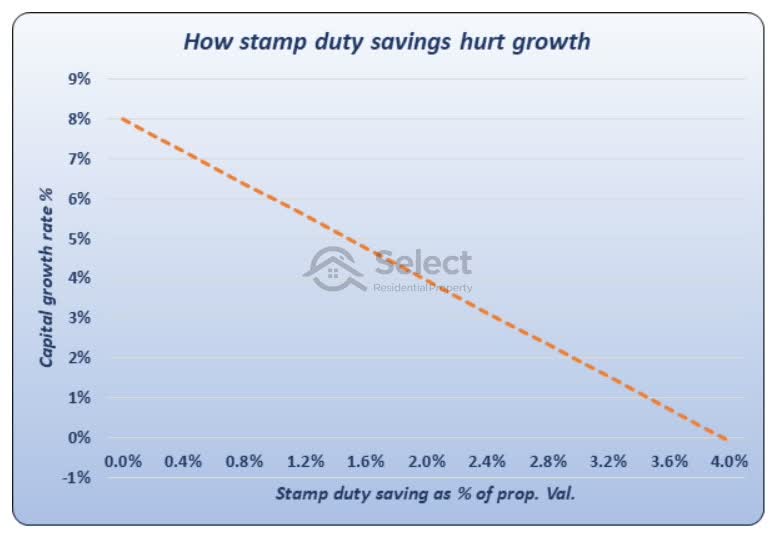
This chart plots the relationship between stamp duty savings and immediate capital growth. You can use this chart to estimate future capital growth for a house and land package based on the stamp duty savings.
Capital growth is shown on the left vertical axis while the stamp duty savings are shown across the bottom of the horizontal axis.
The orange dotted line is saying that the higher the stamp duty savings, the lower the capital growth rate. The stamp duty saving is directly related to how much you’re paying for liability. You want to pay as little for the liability and spend your money instead on the asset. The asset is the land, the liability is the building.
As a rough guide stamp duty is about 4% of a property’s value. It can vary dramatically from state to state, but 4% is a quick and easy round number estimate.
The bottom horizontal axis shows the percentage of the property’s value that is saved in stamp duty.
Extreme example
In the extreme case on the far right, the entire stamp duty amount is saved. That means the land is virtually worthless compared to the overall property’s value. In other words, for properties like this, the value of the property is entirely in the dwelling and not in the land. And that’s why the forecast growth is so low as shown in the bottom left.
Reasonable example
Let’s look at a more reasonable example.
- $500k property
- $8k stamp duty saving
- 6% saving = $8k / $500k
- 5% capital growth
If you’re going to buy a $500,000 property and your stamp duty saving would be $8,000, then you’re looking at about 1.6% of the property’s value in stamp duty savings.
You can see that 1.6% on the bottom axis is roughly in the middle. If we run our eyes up, we can see it meets the orange line at just under 5% capital growth. Now, the baseline growth rate for this chart is 8%. That’s the expected rate of appreciation of the land. But because the property involves some portion of liability, you’re looking at less than 8% overall. But by how much?
Well, in this case, where there’s an $8k stamp duty saving, you’d be underperforming the best-case scenario by a little more than 3% per annum or $15,000 – much higher than the stamp duty saving. And that’s only for the 1st year. Next year there’ll be another $15,000 underperformance, but no more stamp duty savings.
The higher the stamp duty saving, the more it’s going to hurt you in lack of capital growth. Don’t buy new.
Developer strategies
Now, I just want to talk about the key strategy a developer uses to maximise the money they make. They make money from adding value. The key for their profitability is spending the least money to add the most value on the cheapest land.
A profitable project:
- Land $1m
- $400k build
- Total spend = $1.4m
- Sell for $1.75m
- Profit $350k
- ROI 25% ($350k / $1,400k)
Now imagine the same house was built on a cheaper block of land.
A MORE profitable project:
- Land $500k
- $400k build
- Total spend = $900k
- Sell for $1.2m
- Profit $300k
- ROI 33% ($300k / $900k)
The block is now half the price, but the house being built costs the same. The value added as a percentage of the total spend is a lot higher. The developer is paying less for the land. The profitability is much higher in this case.
Taking it a step further and buying really cheap land, makes the profitability even more pronounced.
An even MORE profitable project:
- Land $200k
- $400k build
- Total spend = $600k
- Sell for $850k
- Profit $250k
- ROI 42% ($250k / $600k)
In this case the land is only worth $200k. The build cost is the same but the majority of the project expense comes from value adding – building a house. The land expense is a nuisance to the developer. The developer wants to minimise the cost of the land as a percentage of the project’s total expense.
“Developers want the lowest possible land to asset ratio”
“Investors want the highest possible land to asset ratio”
This is another reason why investors should consider developers as the enemy. As an investor, you should never buy from a developer, you should never buy new.
More reading
For more on the topic of land to asset ratio, check out these topic
Aiming for lots of land misses the point
Avoid properties with high depreciation
One of the things an investor can research to get a bearing on how much capital growth their property is likely to deliver is the “stamp duty savings”. The higher the stamp duty savings, the worse the land to asset ratio is and the worse the property is likely to grow.
Another indicator of low land to asset ratio is depreciation. The higher the depreciation, the lower the land asset ratio.
“Ironically, the biggest indicators of poor future growth are the biggest selling points pushed by proponents of ‘new’ property”
Growth
But there’s another reason why new property will generally have poorer capital growth than established property. Capital growth occurs when demand exceeds supply. Every new property built is additional supply.
“Supply is a kick in the groin for growth.”
Demand is the investor’s friend and supply, our enemy. New properties represent supply – our enemy. Now, why would you want to fund the enemy’s activities? You’re paying someone to harm your growth potential and you’re paying a premium for an inferior investment.
Risk of oversupply
Not only are new properties released in large numbers at the same time, but they’re usually in areas where a large amount of other development could occur in the future, and in some cases, has already been planned for.
Nearby vacant land is a red flag for over-supply. Check the satellite imagery for vacant land that could easily be filled with new houses. And for units, check with local council to see if any development applications have been lodged recently.
Perspective
Please note, I’m not saying that a new property in a hot market can’t outperform an old property in a cold market. All I’m saying is that if everything else is the same and two properties only differ on dwelling age, then the old will outperform the new.
Research
The “research” you’re likely to hear from a developer is probably biased. They do research, but it’s not geared towards holding for capital growth. It’s geared towards developing. Put yourself in the developer’s shoes for a minute.
- Large site
- Bought cheap
- Cram dwellings
- Quickly
- Cheaply
- Sell high
You want to acquire a large site as cheaply as possible. You want to get as many new dwellings on the site as possible as quickly and as cheaply as possible. Then you want to sell them for as much as possible.
Think about each of those points. Picture yourself trying to strategize to maximise profitability on each one. Does capital growth feature in your feasibility, especially for the period after you’ve sold? Why would you even include it in the feasibility? How can you benefit from capital growth after you’ve sold the property? Besides…
“It’s a lot easier to market a project as having growth potential than it is to actually find one”
A developer’s project feasibility doesn’t rest on whether the property will deliver capital growth after they’ve sold. The research a property developer does is NOT geared towards “holding”. It’s geared towards: buying, building and selling. They’re running a business, not a charity.
“Don’t confuse investment research with developer marketing, despite how similar they may seem.”
BIS Oxford
BIS Oxford Economics did some research in early 2019 to measure the performance for off the plan properties in Sydney, Melbourne and Brisbane. Off-the-plan properties are new. They’re so new, they’re actually bought before they’ve even been built, based purely on the plans. Hence the term: off-the-plan.
- Sydney
- 4-year period
- 1 in 4 had no growth
- Melbourne
- 8-year period
- 2 out of 3 had no growth
In Sydney, about a quarter of all off-the-plan properties were the same value or lower 4 years later. And for about half this time, Sydney was in boom conditions. Established suburbs full of older houses had more than 50% growth in the same timeframe.
For Melbourne, the period of analysis was 8 years. And BIS found that off-the-plan properties were either lower than their original purchase price or the same value after 8 years in 2 out of 3 Melbourne apartments. That’s a very long time to hold a property and not have anything positive in the way of growth. And it’s also a very high failure rate.
The following chart shows the growth in Melbourne units in general for that period.
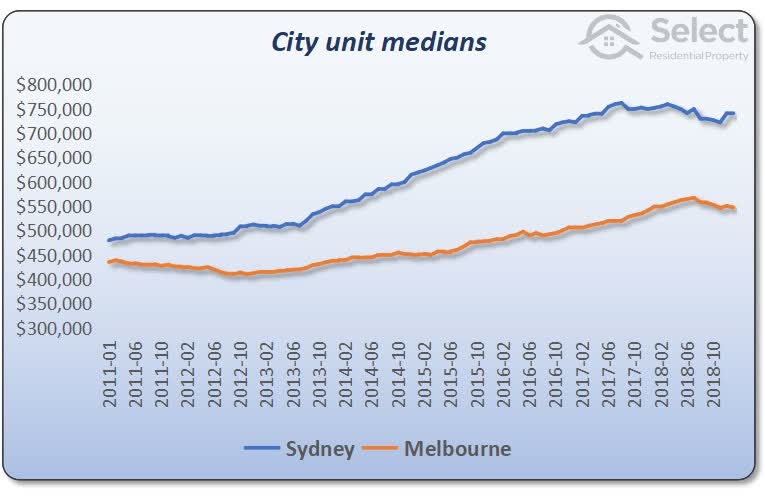
Chart analysis
That growth chart includes both off-the-plan and established properties. Since most off-the-plan properties had zero or negative growth, they have dragged the curve on the chart lower. It would show a steeper line if the off-the-plan units were removed. Clearly, established properties had to outperform new properties to create any upward movement at all.
And look at the Sydney growth curve. It’s hard to believe that over the 4-year period from 2015 there were any units that didn’t have some kind of growth. But the analysis by BIS Oxford Economics found that 1 in 4 had negative or no growth. Again, this confirms what we expect from the maths, that new must underperform established.
QLD dwelling age vs. capital growth
Here’s some more historical evidence supporting the maths. The next chart shows the relationship between capital growth and the age of the dwelling.
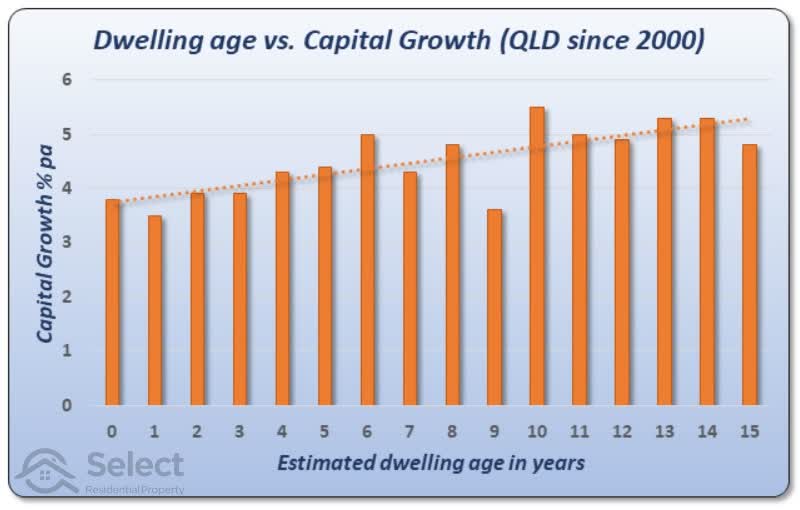
The left vertical axis shows the capital growth as a percentage per annum. The bottom horizontal axis shows the estimated age of dwellings involved.
The trend line is the dotted line across the top of the bars. It shows an approximation for the relationship between age and capital growth. As you can see it goes up from left to right. That means, the older the property is, the better the capital growth rate.
This chart was created using Queensland house sales data from 2000. Now because suburb medians can be influenced by heavy developer activity, these growth rates were calculated on a per-property basis using a repeat sales method. That means, when the same property sold again, for example after it was built, the capital growth was measured for that period between sales. Then that growth was compared with sales of other properties that had different ages at the same time.
The process was repeated again and again for thousands of properties across Queensland right up until June 2019. So, the sample covers a very wide variety of properties from many different suburbs.
Short history
I couldn’t go further back due to limited data about building ages in this data set. Although there were properties 50 plus years old, there were fewer of them and I couldn’t guarantee they hadn’t been rebuilt or undergone significant renovations which might skew the growth calcs.
I also excluded from the chart dwelling ages where there were less than a thousand cases, which is why the age stops at 15 years.
The trend line shows that a brand-new property (seen on the far left of the chart) will underperform a 15-year-old property (seen on the far right of the chart) by about 1.5% per annum. For a $500,000 property that’s about $7,500 for the 1st year.
Depreciation vs. Capital growth
Now you might be thinking, that’s nothing, I can claim $9,000 in depreciation in the 1st year. Maybe true, but for a 30% marginal tax rate, that’s really only a saving of about $3,000. Just because you claim $9,000 doesn’t mean you get $9,000 back from the ATO. And your property has aged by a loss equal to $9,000.
Over 10 years, the choice to buy new instead of 30 years old could cost you $150,000 in reduced growth for a $500k property. That’s way more than you could ever claim in depreciation or save in reduced repairs and maintenance.
Mooloolaba
Let’s look at things from a different perspective to see if we get a different result.
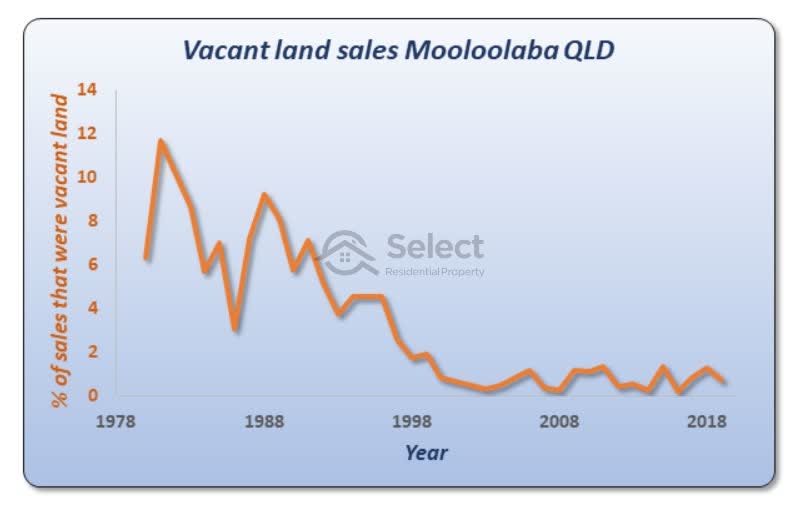
This chart shows the sales of vacant land in Mooloolaba in the Sunshine Coast for the last 40 years. It shows vacant land sales as a percentage of all sales. This is another way in which we can see how much new property is coming onto the market. You can see that there was a lot in the 80s and 90s, but by the turn of the century Mooloolaba had been built out already and the number of sales of vacant land was typically less than 1%.
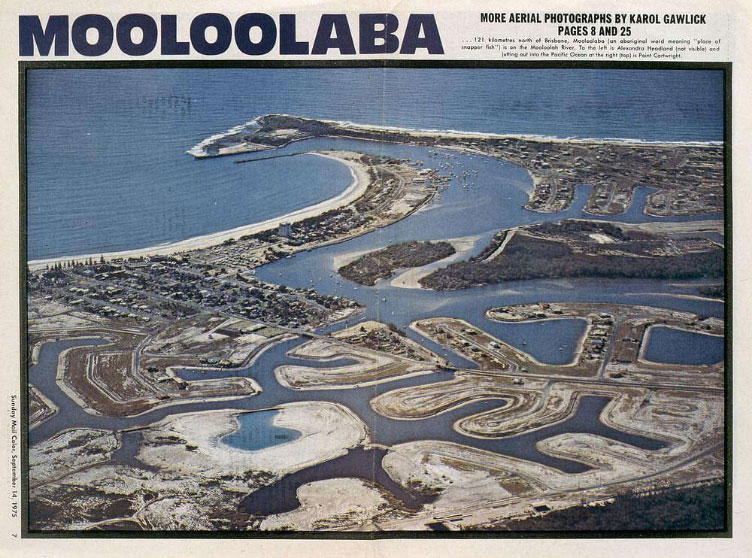
Here’s a picture of Mooloolaba from the air just before all these vacant land sales. This photo appeared in the Sunday Mail newspaper in September 1975. Notice a lot of the land has been cleared ready for new dwellings.
And here’s a more recent photo of Mooloolaba.
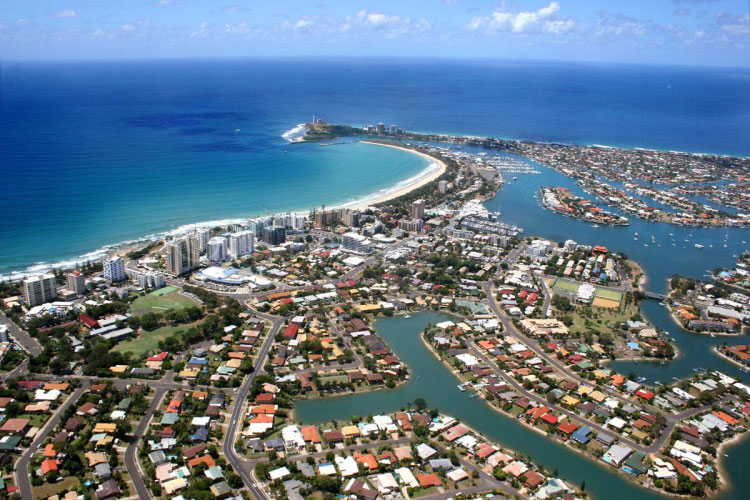
Even the land that wasn’t cleared has houses on it now. If you want to build a new house now, you probably need to knock down an existing one.
Here’s another photo…
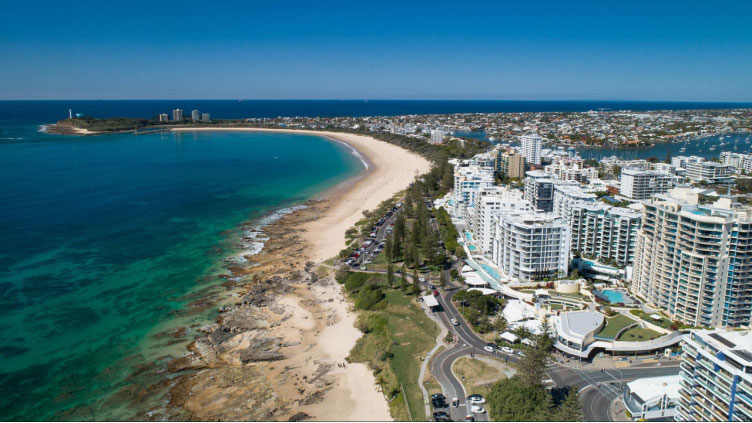
…which shows how fully developed Mooloolaba has become. (Cracking spot isn’t it).
Mooloolaba performance
How did all this new property affect price growth in Mooloolaba?
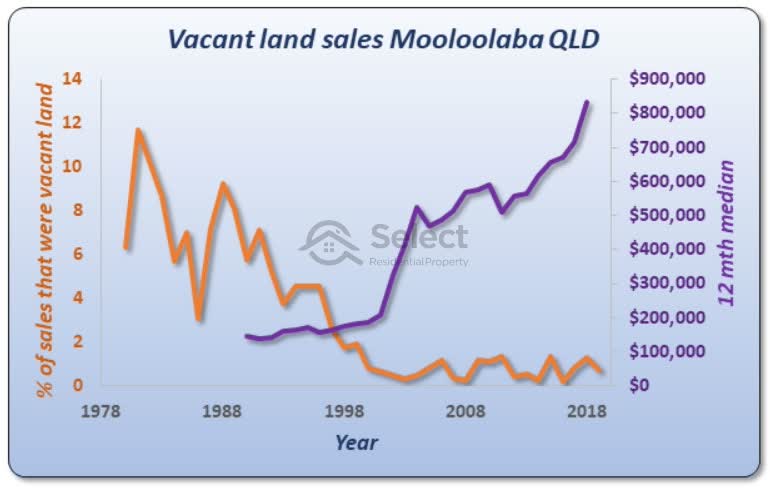
I’ve added an extra line to the chart you saw before. The purple line shows the 12-month median from 1990 to today. You can see how flat the growth started out for about 10 years up until the turn of the century when most of the vacant land dried up. And that’s when prices took off.
Now admittedly, there was a period of tremendous growth across QLD soon after the turn of the century. But QLD in general has been weak for the last 10 years. But not Mooloolaba. And much of the problem with Queensland’s growth over the last decade has been attributable to supply. Developers have been easily able to keep pace with demand and that has kept a lid on price growth.
Not only does new property perform poorly on its own, but it’s usually accompanied by lots of other new property which creates over-supply and growth is subdued.
Pimpama
Here is one of the worst examples of the over-supply issue in QLD right now.
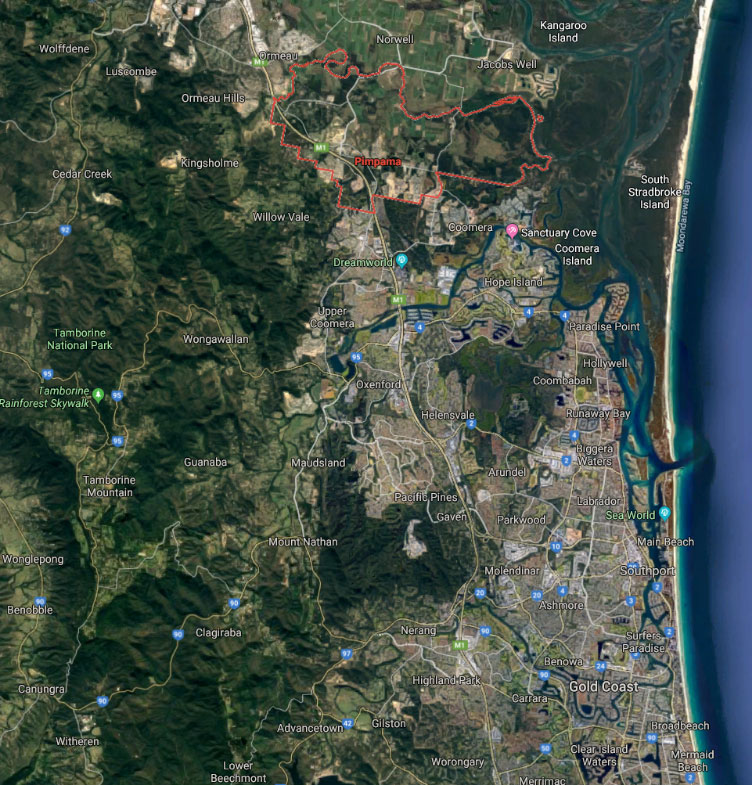
Pimpama.
It sits between Brisbane and the Gold Coast. And currently its largely undeveloped land.
You can see in this image the townships that have been built out to the south and north west. But Pimpama is largely undeveloped. And there’s loads of vacant land.
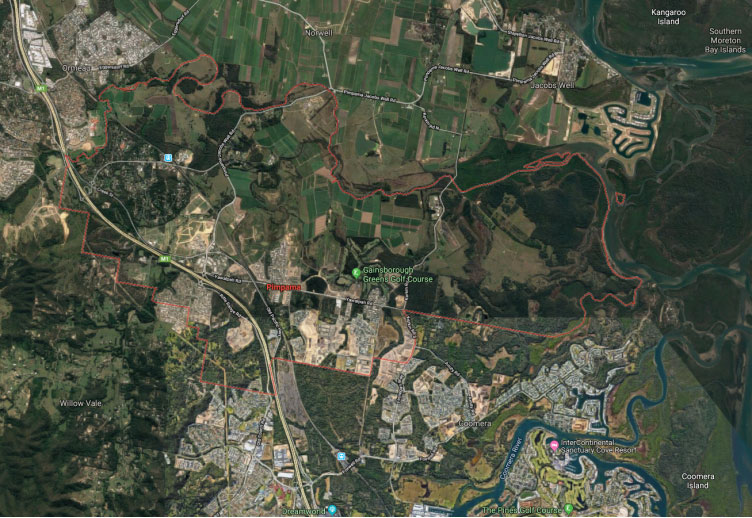
Zooming in a little further…
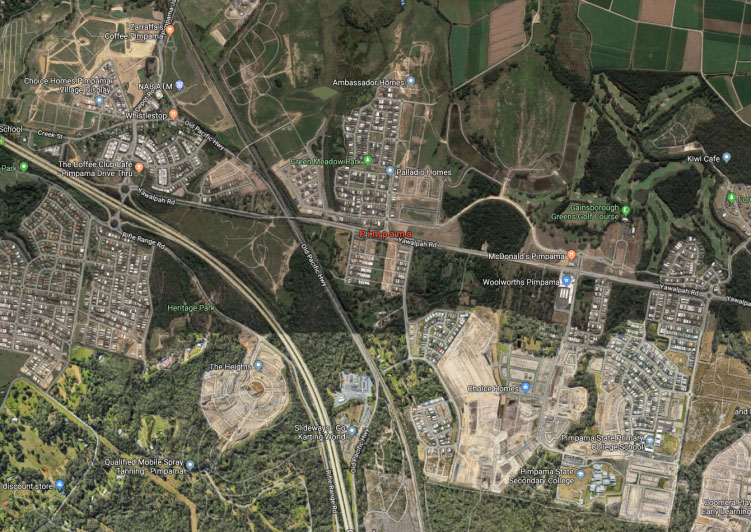
We can see loads of brown patches. This is where developers have cleared trees to chop up fresh blocks of land for sale. If we zoom in more…
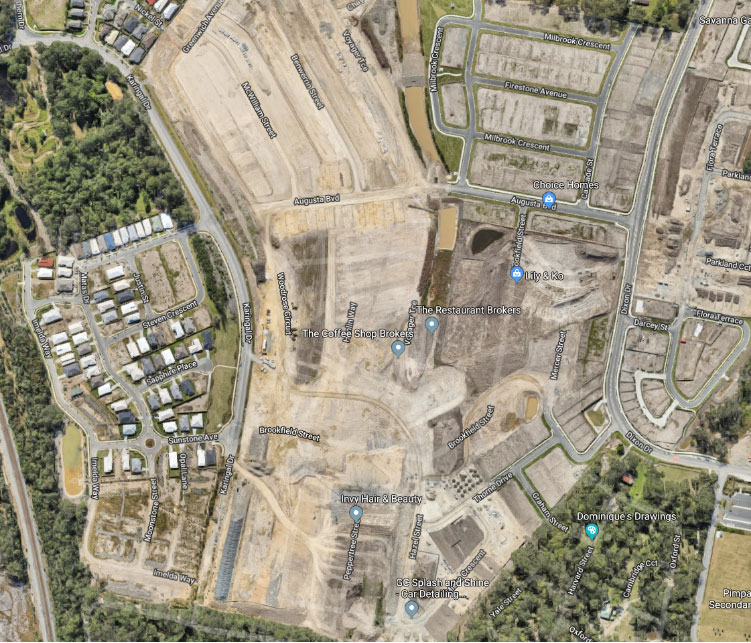
…we can see the subdivisions and some of the new houses being knocked up already.
This kind of thing is called a “growth corridor” by developers. But it’s a nightmare to investors. Steer clear of this sort of thing if you want any capital growth.
“What developers call a growth corridor; investors should call a supply corridor”
Don’t expect any growth in values from properties in this area and neighbouring suburbs like Ormeau.
Pimpama performance
Here’s that vacant land chart…
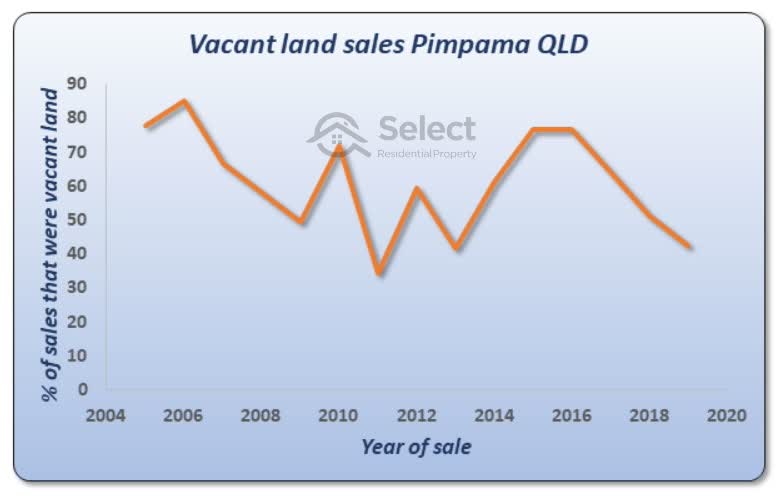
Have a close look at the left axis. It goes as high as 85% of all sales being vacant land. You saw how flat the growth was for Mooloolaba before. At its peak, Mooloolaba never got above 20% of sales were vacant land.
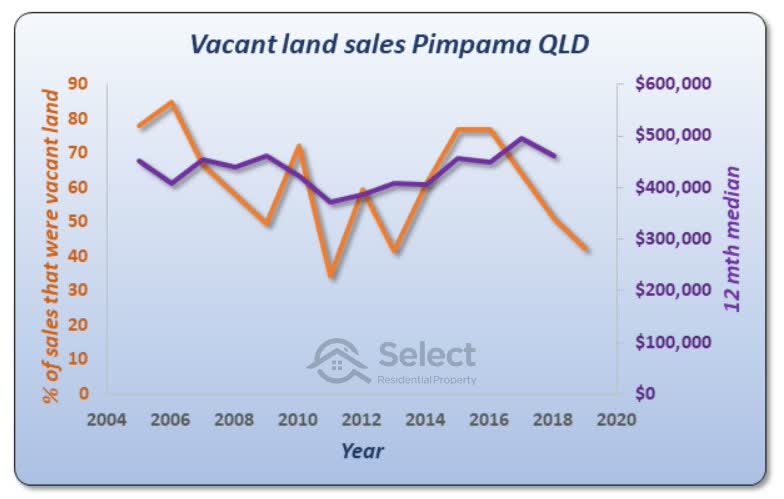
There has been effectively no capital growth in Pimpama since 2005 which is when the new properties started popping up. This chart shows the 12-month median which suggests prices have at least held up under the weight of development and even had 3% growth for the last 7 years. But actually, the median in these cases is not a good reflection of what’s going on.
Capital growth that is calculated using a change in median is often skewed higher than reality in markets where there’s heavy development activity. A better approach in the case of greenfield estates is to calculate capital growth using re-sales of the same properties.
“Pimpama house resales for the 14 years from 2004 have averaged 2.9% per annum “
That’s a long time to hold a negatively geared property that’s growth is barely keeping up with inflation.
Pimpama is still a death trap for capital growth and could be for decades to come given how much more land can be developed, as you saw in the satellite imagery. But I can guarantee developers will continue promoting this patch of dirt to investors for years to come. Never buy new.
Conclusion
New property underperforms established or old property because of the lower land to asset ratio and therefore higher depreciation. It not only makes perfect sense from a mathematical perspective, there’s also evidence from historical data to confirm it.
How can there be such a fierce debate on new vs. old when the numbers are so straight-forward? It’s because of bias and marketing that is often disguised as education, research or investment advice.
A good question to ask an advisor is:
“How do you get paid?”
If they’re paid in any way by the developer, obviously they’re opinion is biased.
I make no money whether investors buy new or old. My recommendation is purely based on what the logic suggests, what the maths proves to be true and of course what the data confirms.
“New property underperforms old”
Now, having said that, it’s not impossible to make some money from new property. If demand exceeds supply, prices will go up, even if the property is new. But if you’ve got a choice, you’d obviously go for old rather than new. And if you’re a novice investor, stick to that general rule. Steer clear of new properties.
“Property age is the easiest research delivering the best bang for buck – never buy new”
Some other topics in this series that touch on very similar topics include
| Aiming for lots of land misses the point |
| Avoid properties with high depreciation |
And there are more in this series you should have a squiz at to avoid making newby mistakes. They’re a great “heads-up” about some of the more dastardly deceptive marketing tricksies being sprayed about.